

The bitcoin price started Monday with a small recovery to compensate for Sunday’s massive losses, but crypto investors shouldn’t get their hopes up.
Bitcoin (BTC/USD) established its intraday high at $3,861, up around 1 percent for the 24-hour period. On Sunday, the pair dropped approximately 10 percent in just 9 hours – a dump, precisely. It started consolidating upwards after finding a new low at $3,721. At the same time, the bitcoin market reported lower intraday volume and volatility, indicating that the bearish action was still far from over.
BITCOIN PRICE FACES STIFF RESISTANCE ABOVE $4,200
In late November 2018, the bitcoin price had broken below its so-called bottom area at $6,000. The cryptocurrency attempted its first strong upside correction on November 23 when it recovered from $3,453 to $4,419. However, it failed to extend its bullish momentum every time it came near a specific resistance area. Have a look at the daily chart below for illustration.
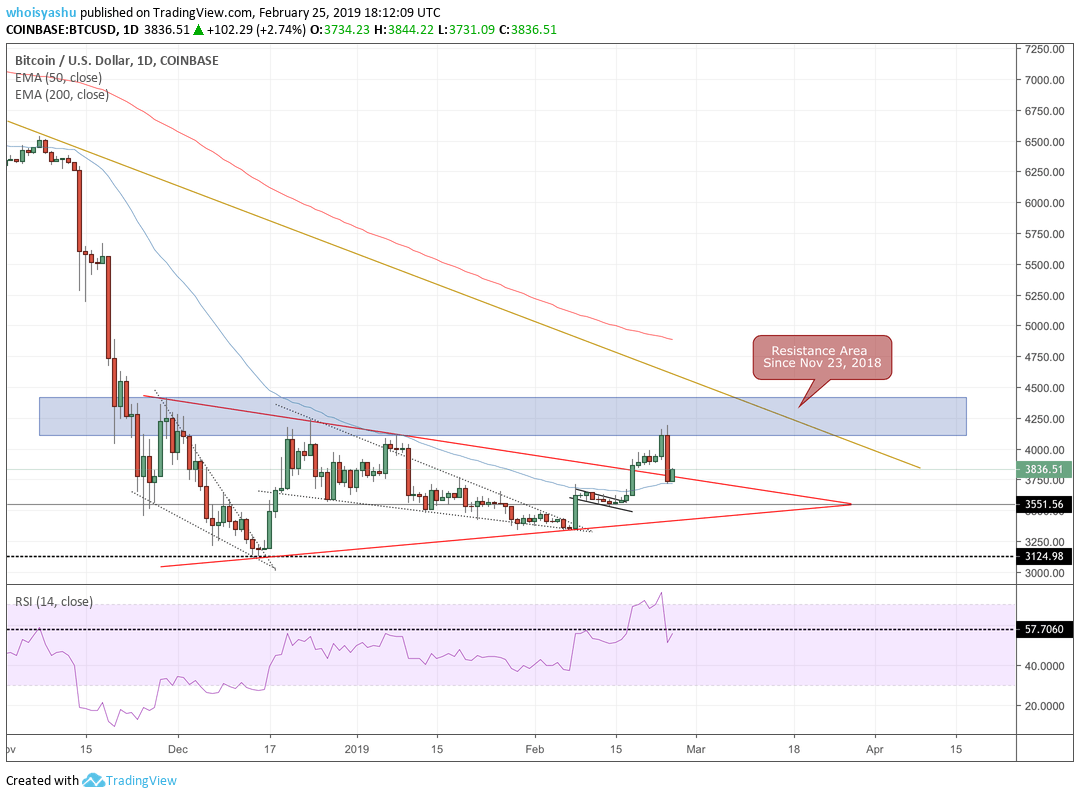
BITCOIN 1D PRICE CHART | SOURCE: COINBASE, TRADINGVIEW.COM
Since the first upside attempt, BTC/USD has attempted to cross above the resistance areaon five separate occasions. At the same time, we can see how the 50-period moving average (depicted in the blue curve above) has also capped bullish attempts. Recently, bitcoin broke above that moving average to establish an interim bullish bias. Nevertheless, the pair met the “resistance area” that prevented the rally from extending any further.
Upon the bearish divergence action from the area, bitcoin moved back towards the 50-period EMA. Surprisingly, the blue curve switched from being resistance to being support. We can see the two daily candles in the end in the chart above supported by the 50-period EMA. We can expect it to hold the downside action for a while.
At the same time, if bitcoin breaks below the 50-period EMA, then the cryptocurrency could target $3,551 as the next potential support.
BITCOIN FORMING BEAR FLAG
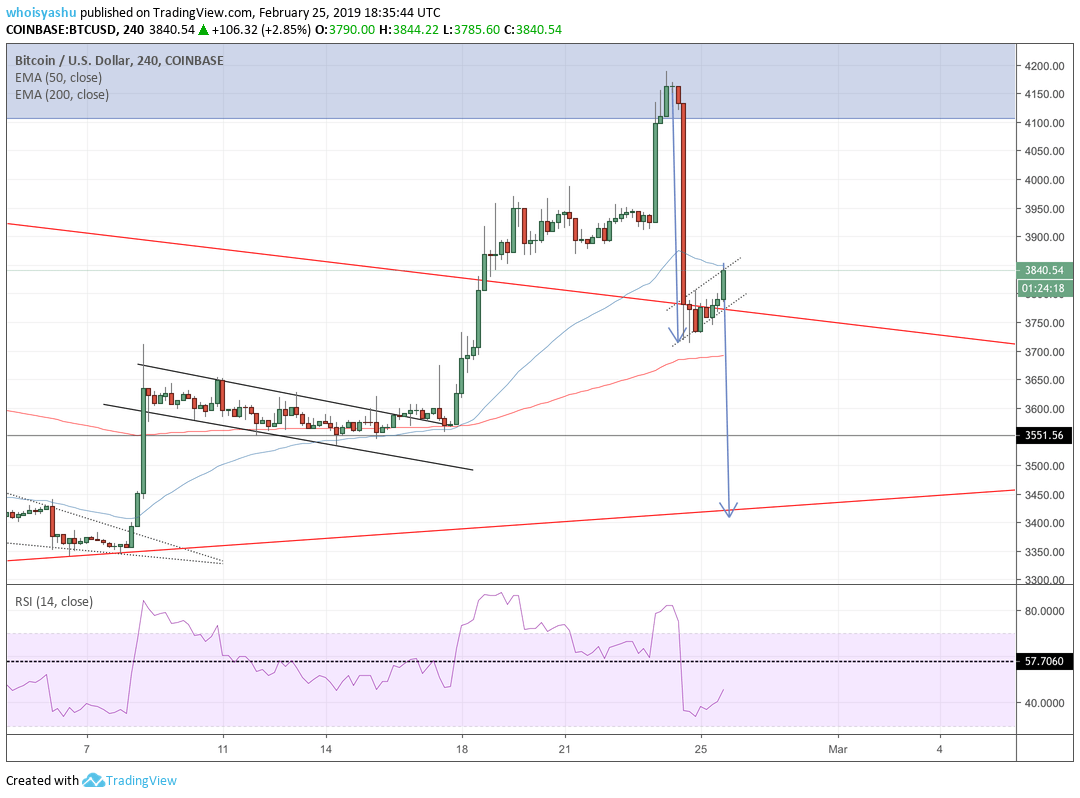
BITCOIN 4H PRICE CHART | SOURCE: COINBASE, TRADINGVIEW.COM
Bitcoin is now in the first wave of a potential downside move, as evidenced by the formation of a bear flag. While there is a possibility that the price will reverse back towards the “resistance area” – as mentioned in the section above – the overall sentiment and the price action in recent months indicate that bitcoin is due for an extended bear run.
A breakdown action from where bitcoin is right now would be confirmed once the price tests the so-called flag support. At the same time, traders would see a rise in volume. It could pose as an excellent opportunity for short traders, with a potential initial downside target towards $3,551. Adventurous traders could also be eyeing the support trendline of medium-term triangle formation (depicted via a rising red trendline).
TRADERS SHOULD PRESS PAUSE ON INTRADAY BITCOIN PRICE STRATEGY
We are not yet sure about how we would like to play the market. There is a clear bias conflict concerning the direction of the next price action. Consequently, our priority should be to wait and confirm a breakout/breakdown to understand the extent of our positions. Overall, going by the look of bitcoin performance in the past 24 hours, we don’t expect the ongoing bullish correction to continue.
Trade safely!
Featured Image from Shutterstock. Price Charts from TradingView.


No comments:
Post a Comment