
Ripple is trading in a bearish zone below the $0.2800 resistance against the US Dollar. XRP price could extend its decline below $0.2700 if it fails to surpass $0.2800.
- Ripple is currently declining and trading well below the $0.2800 resistance against the US dollar.
- The price is approaching the $0.2730 and $0.2710 support levels.
- There is a significant bearish trend line forming with resistance near $0.2765 on the hourly chart of the XRP/USD pair (data source from Kraken).
- The pair could either start a real recovery above $0.2800 or decline sharply below $0.2700.

Ripple Price Near Inflection Point

Ripple price failed to stay above the $0.2840 support and extended its decline. XRP broke the $0.2800 support level and the 100 hourly simple moving average to move further into a bearish zone.
It traded to a new weekly low at $0.2710 and recently started an upside correction. However, the upward move was capped by the $0.2800 level (support turned resistance). A high is formed near $0.2810 and the price is currently declining.
There was a break below the $0.2780 and $0.2760 levels. Ripple is now trading near the 61.8% Fib retracement level of the recent recovery from the $0.2710 low to $0.2810 high.
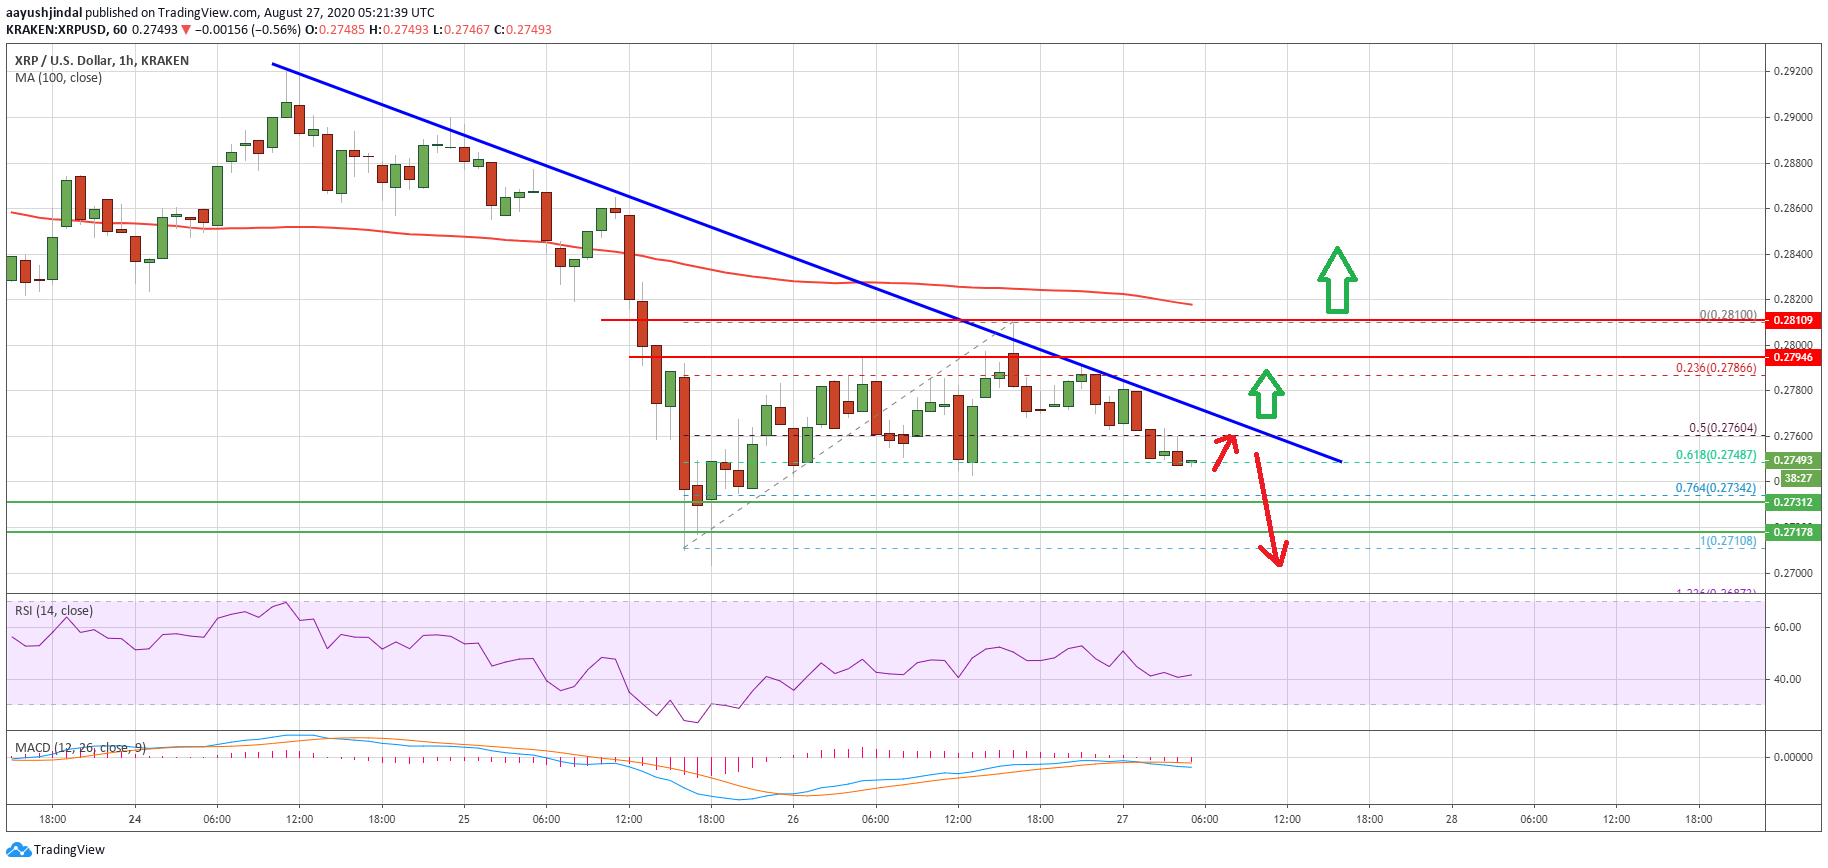
Ripple price trades below $0.2800. Source: TradingView.comIt seems like there is a significant bearish trend line forming with resistance near $0.2765 on the hourly chart of the XRP/USD pair. To move into a positive zone, the price must break the trend line resistance at $0.2765.
The main hurdle is still near $0.2800 and the 100 hourly SMA, above which the price could start a sustained upward move. The next resistance might be $0.2880 and $0.2900, followed by the key $0.2920 pivot level.
Bearish Break in XRP?
If ripple struggles to clear above the trend line resistance and $0.2800, there is a risk of a bearish break below the $0.2730 and $0.2710 support levels in the near term.
The next major support is near the $0.2680 level, below which the price could dive towards the $0.2620 and $0.2600 levels. Any further losses are likely to lead the price towards the $0.2550 level.
Technical Indicators
Hourly MACD – The MACD for XRP/USD is now gaining pace in the bearish zone.
Hourly RSI (Relative Strength Index) – The RSI for XRP/USD is declining and it is well below the 50 level.
Major Support Levels – $0.2730, $0.2710 and $0.2620.
Major Resistance Levels – $0.2765, $0.2800 and $0.2840.


No comments:
Post a Comment