
Ripple is struggling to clear the key $0.2150 resistance area against the US Dollar. XRP price is showing a few bearish signs and it could resume its decline below $0.2110.
- Ripple price is likely to start a fresh decline below $0.2100 against the US dollar.
- The price is facing a lot of hurdles near the $0.2140 and $0.2150 levels.
- There is a short term ascending channel forming with support near $0.2115 on the hourly chart of the XRP/USD pair (data source from Kraken).
- The price might start a strong increase if it clears the main $0.2150 resistance area.
Ripple Price Is Facing Hurdles
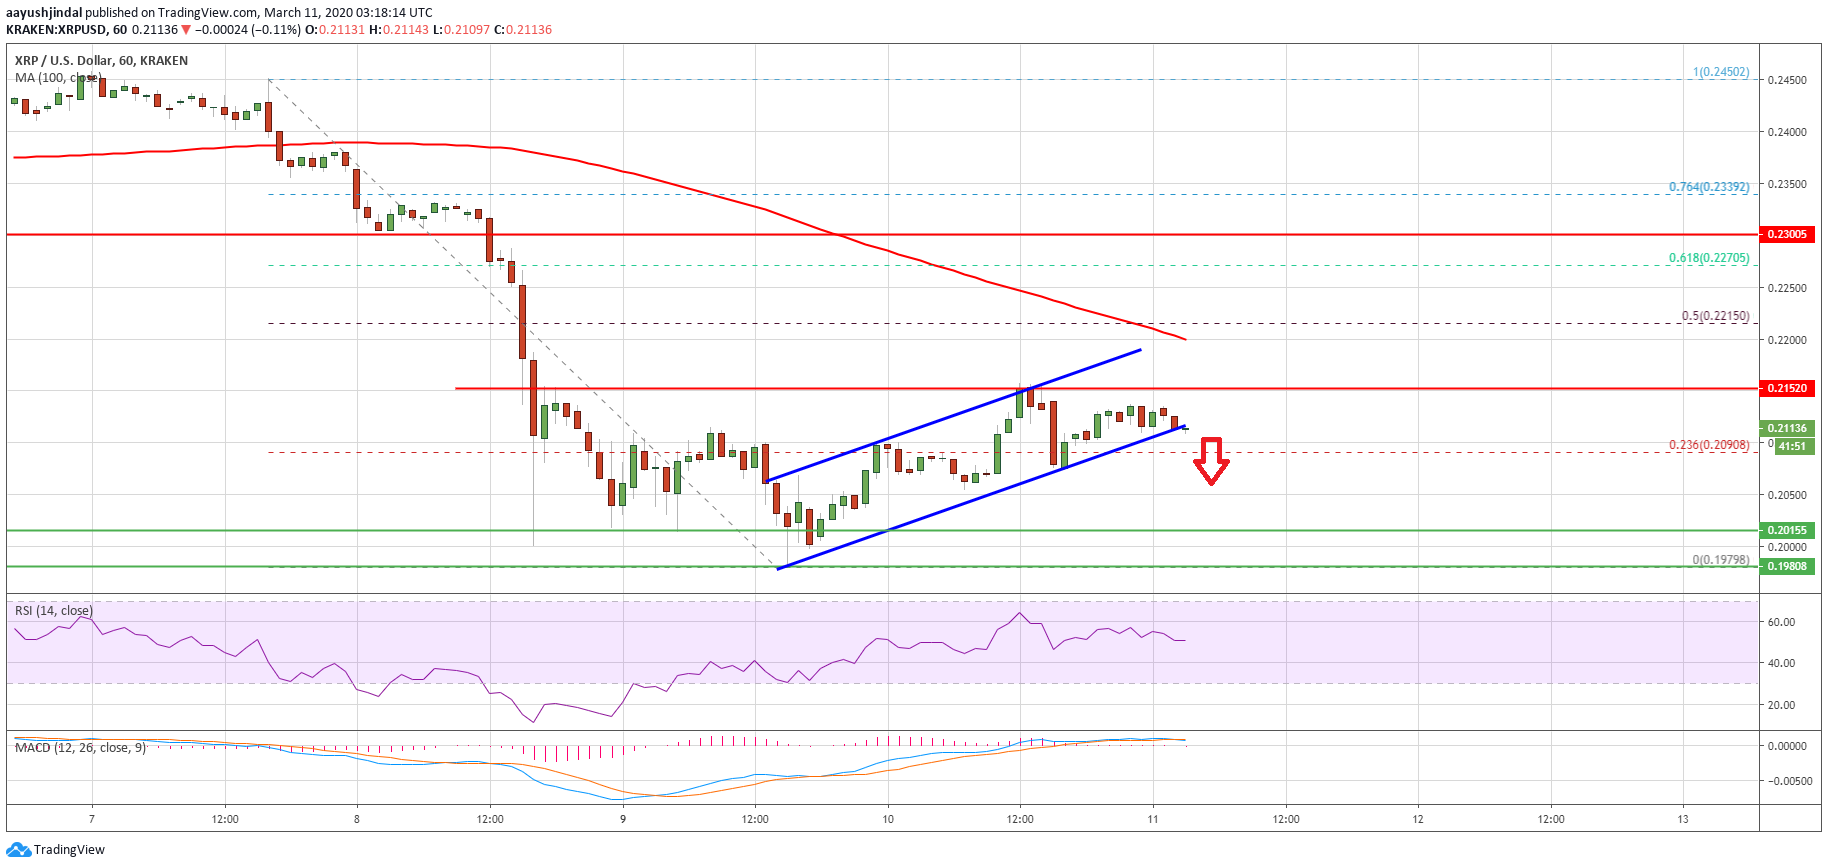
Yesterday, we discussed a couple of important hurdles for ripple near the $0.2150 area. XRP price started a decent upward move from the $0.1978 swing low and climbed above the $0.2000 and $0.2050 levels.
It managed to climb above the 23.6% Fib retracement level of the key decline from the $0.2450 high to $0.1978 low. The bulls were able to push the price above the $0.2100 resistance area, but it failed to gain pace above the $0.2140 and $0.2150 resistance levels.
The price action suggests that ripple was rejected near the $0.2150 resistance. It is currently declining and trading below the $0.2125 level. Moreover, there is a short term ascending channel forming with support near $0.2115 on the hourly chart of the XRP/USD pair.
Ripple Price
If the pair fails to stay above the $0.2115 and $0.2100 support levels, it is likely to resume its decline. An initial support below $0.2100 is near the $0.2050 level. Any further losses could start a sharp and steady decline towards the $0.1980 level in the near term.
Chances of a Strong Recovery
The 50% Fib retracement level of the key decline from the $0.2450 high to $0.1978 low is also near the $0.2215 level to act as a key resistance. To start a fresh increase and a strong recovery, the bulls need to surpass the $0.2150 hurdle and then gain pace above the $0.2200 pivot level.
Technical Indicators
Hourly MACD – The MACD for XRP/USD is slowly moving back into the bearish zone.
Hourly RSI (Relative Strength Index) – The RSI for XRP/USD is currently just above the 50 level.
Major Resistance Levels – $0.2150, $0.2200 and $0.2215.
No comments:
Post a Comment