
Bitcoin extended its rise towards the $10,500 resistance area against the US Dollar. BTC is now showing signs of exhaustion and it could dip a few points before continuing higher.
- Bitcoin price is struggling to gain momentum above $10,400 and $10,450 against the US Dollar.
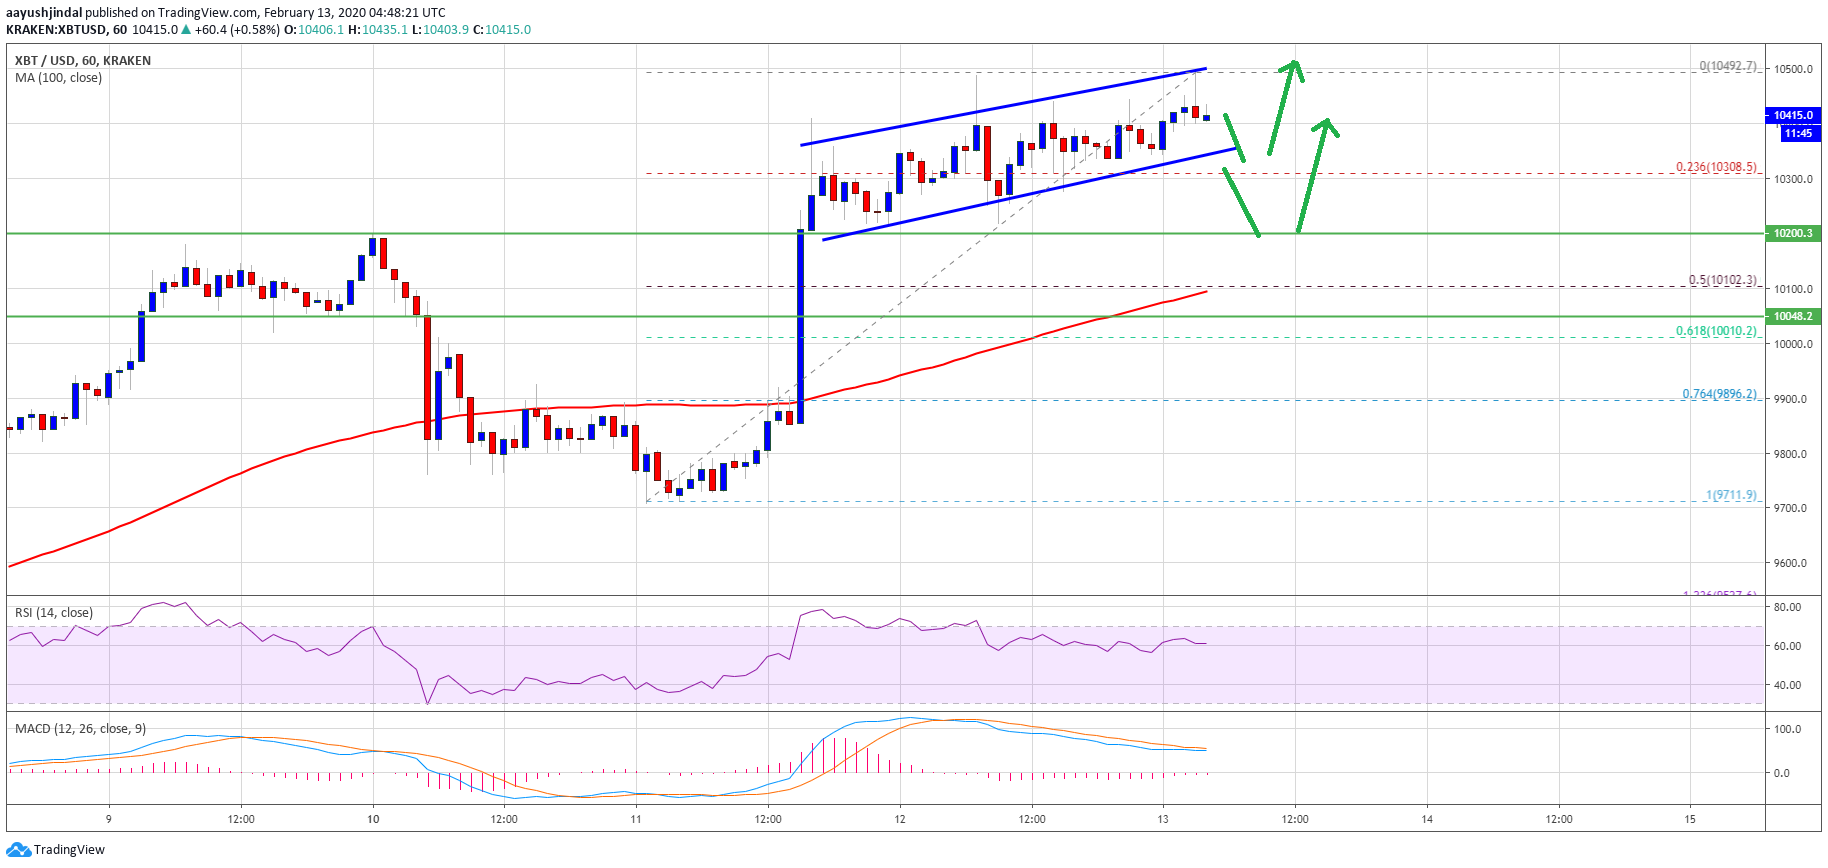
- The price traded to a new 2020 high at $10,492 and it is currently correcting lower.
- There is a short term ascending channel forming with support near $10,350 on the hourly chart of the BTC/USD pair (data feed from Kraken).
- The pair could dip towards the $10,300 support or $10,200 before it climbs above $10,500.

Bitcoin Losing Bullish Momentum
This week, bitcoin bounced back above the $10,000 resistance against the US Dollar. BTC price even broke the $10,200 resistance and the 100 hourly simple moving average.
Recently, there was a push towards the $10,500 resistance area, but the bulls failed to gain bullish momentum. A new 2020 high is formed near $10,492 and the price is currently correcting lower.
An initial support is near the $10,400 level. However, the first key support is seen near the $10,350 level. More importantly, there is a short term ascending channel forming with support near $10,350 on the hourly chart of the BTC/USD pair.
Bitcoin Price
On the upside, bitcoin price seems to be facing a tough resistance near $10,500. The bulls seem to be exhausted and there are chances of a short term correction below $10,350.
The main support on the downside is near the $10,200 level, where the bulls are likely to take a stand. Any further downsides might lead the price towards the key $10,100 support area. It coincides with the 100 hourly SMA and the 50% Fib retracement level of the recent wave from the $9,711 low to $10,492 high.
Upside Targets
Once the current correction wave is complete, the price is likely to resume its rise above $10,450 and $10,500. In the mentioned case, bitcoin could aim a sharp move towards the $11,000 barrier.
An intermediate resistance could be $10,800. The overall price action suggests there are high chances of a minor dip towards $10,200 or $10,100 before a run towards $11,000.
Hourly MACD – The MACD is slowly moving into the bearish zone.
Hourly RSI (Relative Strength Index) – The RSI for BTC/USD is still above the 50 level, with positive signs.
Major Support Levels – $10,200 followed by $10,100.
Major Resistance Levels – $10,450, $10,500 and $11,000.


No comments:
Post a Comment