BITCOIN (BTC) PRICE CHART FORECAST:
- Bitcoin has continued to slip since last week, testing the area beneath longstanding support
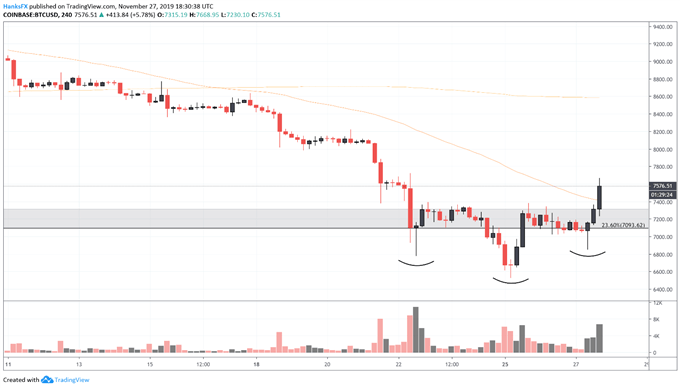
- However, an inverse head and shoulders pattern on the 4-hour chart could suggest gains are ahead
- While the near-term outlook has turned bullish, the longer-term downtrend may remain intact
BITCOIN PRICE CHART TURNS BULLISH, WHAT DOES THIS MEAN FOR BTC/USD?
After suffering weeks of losses, the outlook for Bitcoin may have just turned bullish with the formation of an inverse head and shoulders pattern. Employing a band of support from May as the neckline, brief probes beneath $7,000 have created two shoulders and a head – creating an almost textbook formation of the bullish indicator. Since inverse head and shoulder patterns typically denote a bottom, Bitcoin could enjoy a brief respite from its longer-term downtrend, but it becomes a question of how far, and for how long, Bitcoin bulls will push the cryptocurrency – if at all.
BITCOIN PRICE CHART: 4 - HOUR TIME FRAME (NOVEMBER 11 – NOVEMBER 27) (CHART 1)

Given the distance between the top of the neckline and the head, it could be argued the formation may drive Bitcoin as high as $8,100 – but this is far from certain. Further still, traders typically look for a surge in volume to accompany the initial break above the neckline, an aspect that could have been stronger in this particular instance. Still, amidst a bleak outlook, the formation should be a welcome sign for believers in the largest cryptocurrency by market cap.
That being said, I still maintain my bearish bias for the coin’s medium-term outlook. To that end, Bitcoin’s presence beneath support that I previously highlighted at $7,000 and $6,500 – albeit brief – speaks to the continued strength of bears. While bears and bulls battle it out, follow @PeterHanksFX on Twitter for Bitcoin news and analysis.


No comments:
Post a Comment