- Ripple reflected a slight drop in the price.
- In order to have a marked recovery, the coin should take a long leap in the upcoming days.
Ripple (XRP) price has always reflected a remarkable movement. The first two quarters were quite flourishing for the traders who invested in Ripple. However, from the beginning of the third quarter, the price started moving down. Ripple has tried hard to keep the price up, but market pressure superseded the efforts.
If we look at the last week’s chart, the price movement will reflect an astounding movement. It has touched some unexpected highs and lows.
XRP to USD Price Comparison

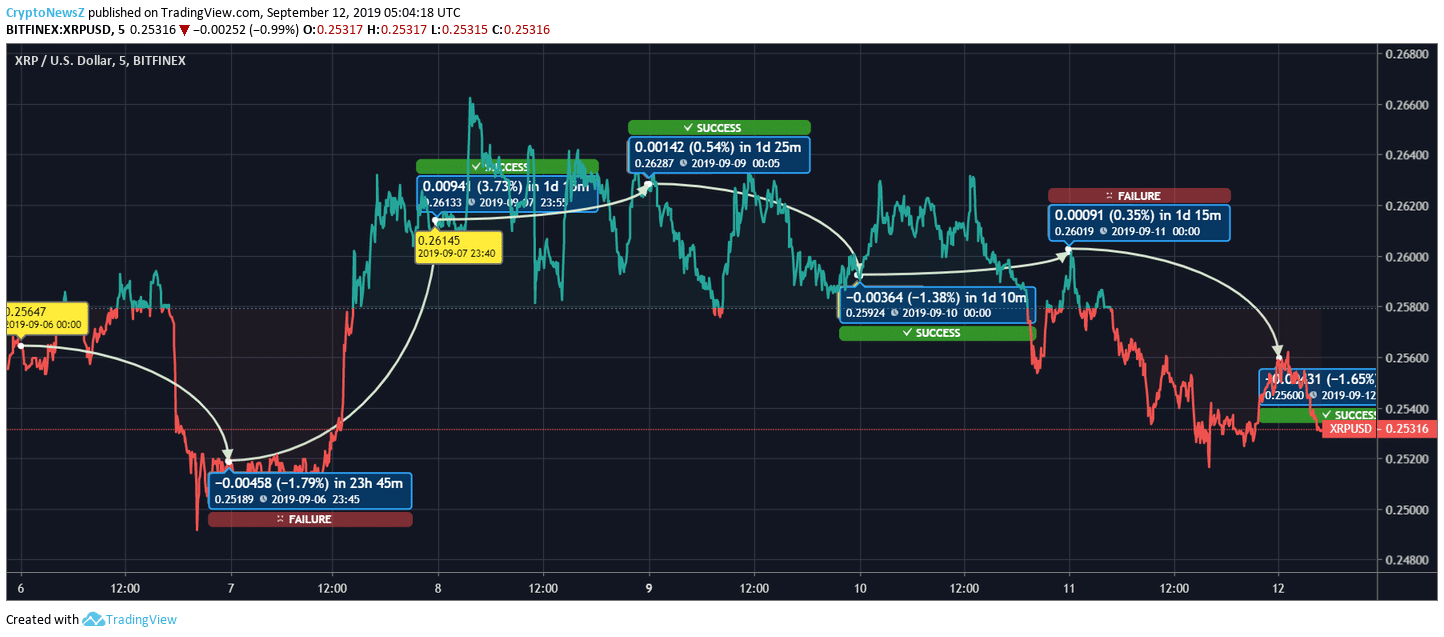
The above XRP/USD price chart reflects quite a volatile movement in the past week. Starting from 6th September, the price slipped from $0.256 to $0.251, marking a regression of 1.79%. On 7th September, the price booked an escalation of 3.73% which took the price to $0.261 which continued on the following day as well as the price jumped to $0.262 with an uptrend of 0.54%.
On 9th September, there was a fall in the price which took the coin as low as $0.259 by 1.38% from the latter price mark. On 10th September, there was a slight improvement in the price, which helped XRP to remain at the level of $0.26. However, yesterday, it felt a pullback which dragged the price to $0.256 with a loss of 1.65%. Ripple is currently trading at $0.253.
Ripple Price Prediction
If we compare the price counters of XRP from the beginning of the week till today, it was trading at $0.256 while the current price of XRP (at the time of penning down) is at $0.253, then the regression of the coin would be of 1.33%. Ripple has a high possibility of turning the losses into profits with its marked momentums in the past.
Ripple is anticipated to give massive results to the long-term traders. However, the short-term investment doesn’t hold much expectation but might fetch moderate profit to the traders.


No comments:
Post a Comment