
The altcoin market continues to lose ground against Bitcoin and the US Dollar.
- Bitcoin’s rise has been at the expense of the rest of the cryptocurrency market.
- I am crazy bullish at these levels.

Major lows continue in the altcoin
New all-time and multi-year lows against Bitcoin continue to plague the altcoin market. While there has been some evidence suggesting a rotation of capital out of Bitcoin and into the altcoin market, this has not been sustained nor yielded any sustained gains in the broader altcoin market. Since the beginning of July, Bitcoin has experienced a minor pullback while altcoins were slammed lower and continue to drop against Bitcoin. Let’s look at some of those now:
Cardano (ADA)
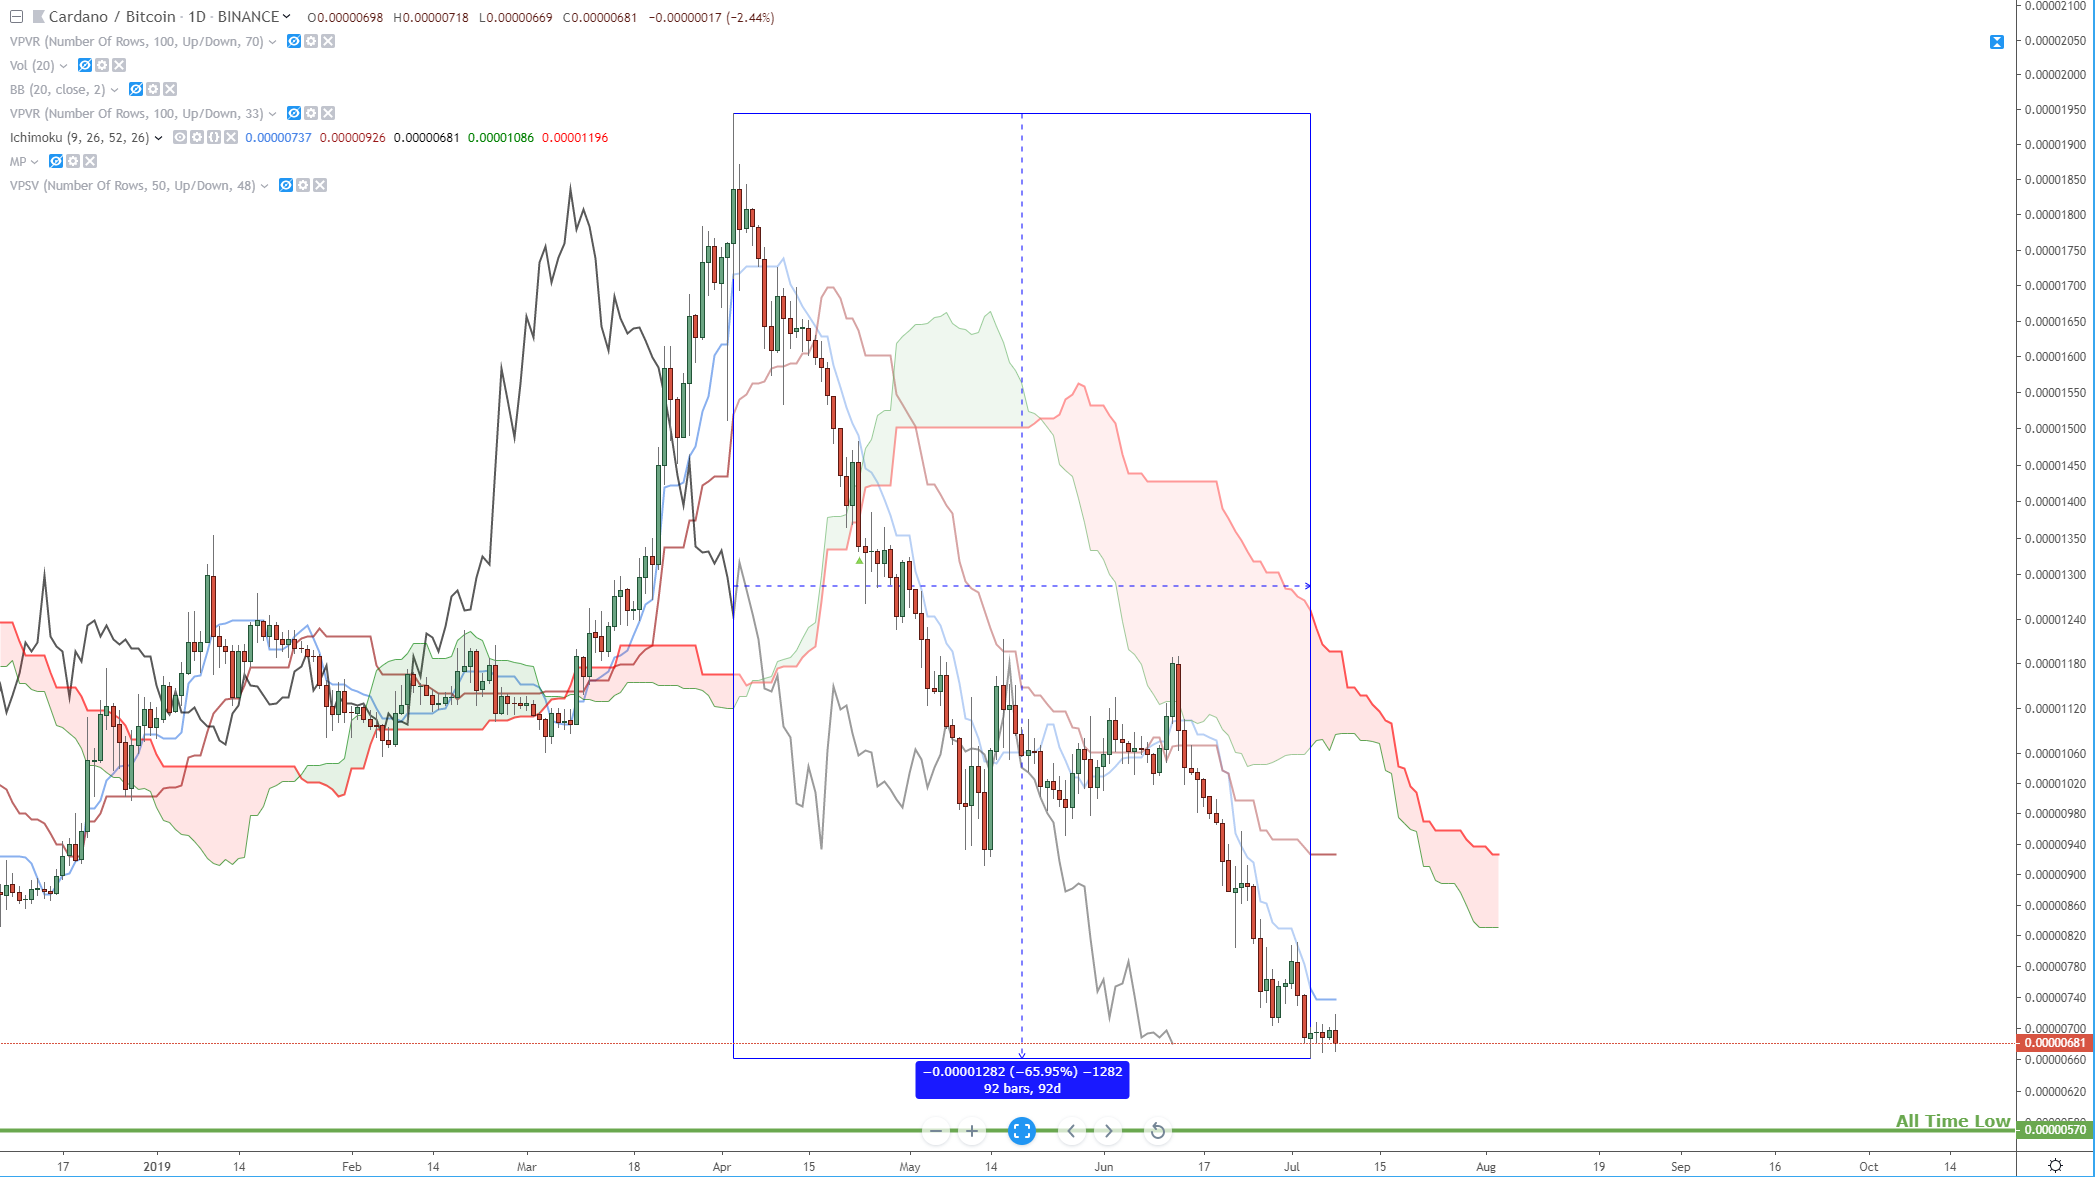
Above: New major lows for Cardano.
Cardano (ADA) – From the April 3rd, 2019 high of 0.00001944, Cardano has dropped -0.0001282 (-65.92%) against Bitcoin over a 92 day period. The current swing low occurred on July 4th at 0.00000662. This low is well below the bottom range of the bear market that existed for Bitcoin in all of 2018. Cardano’s all-time low is just a short distance at 0.00000570.
Stellar Lumens (XLM)
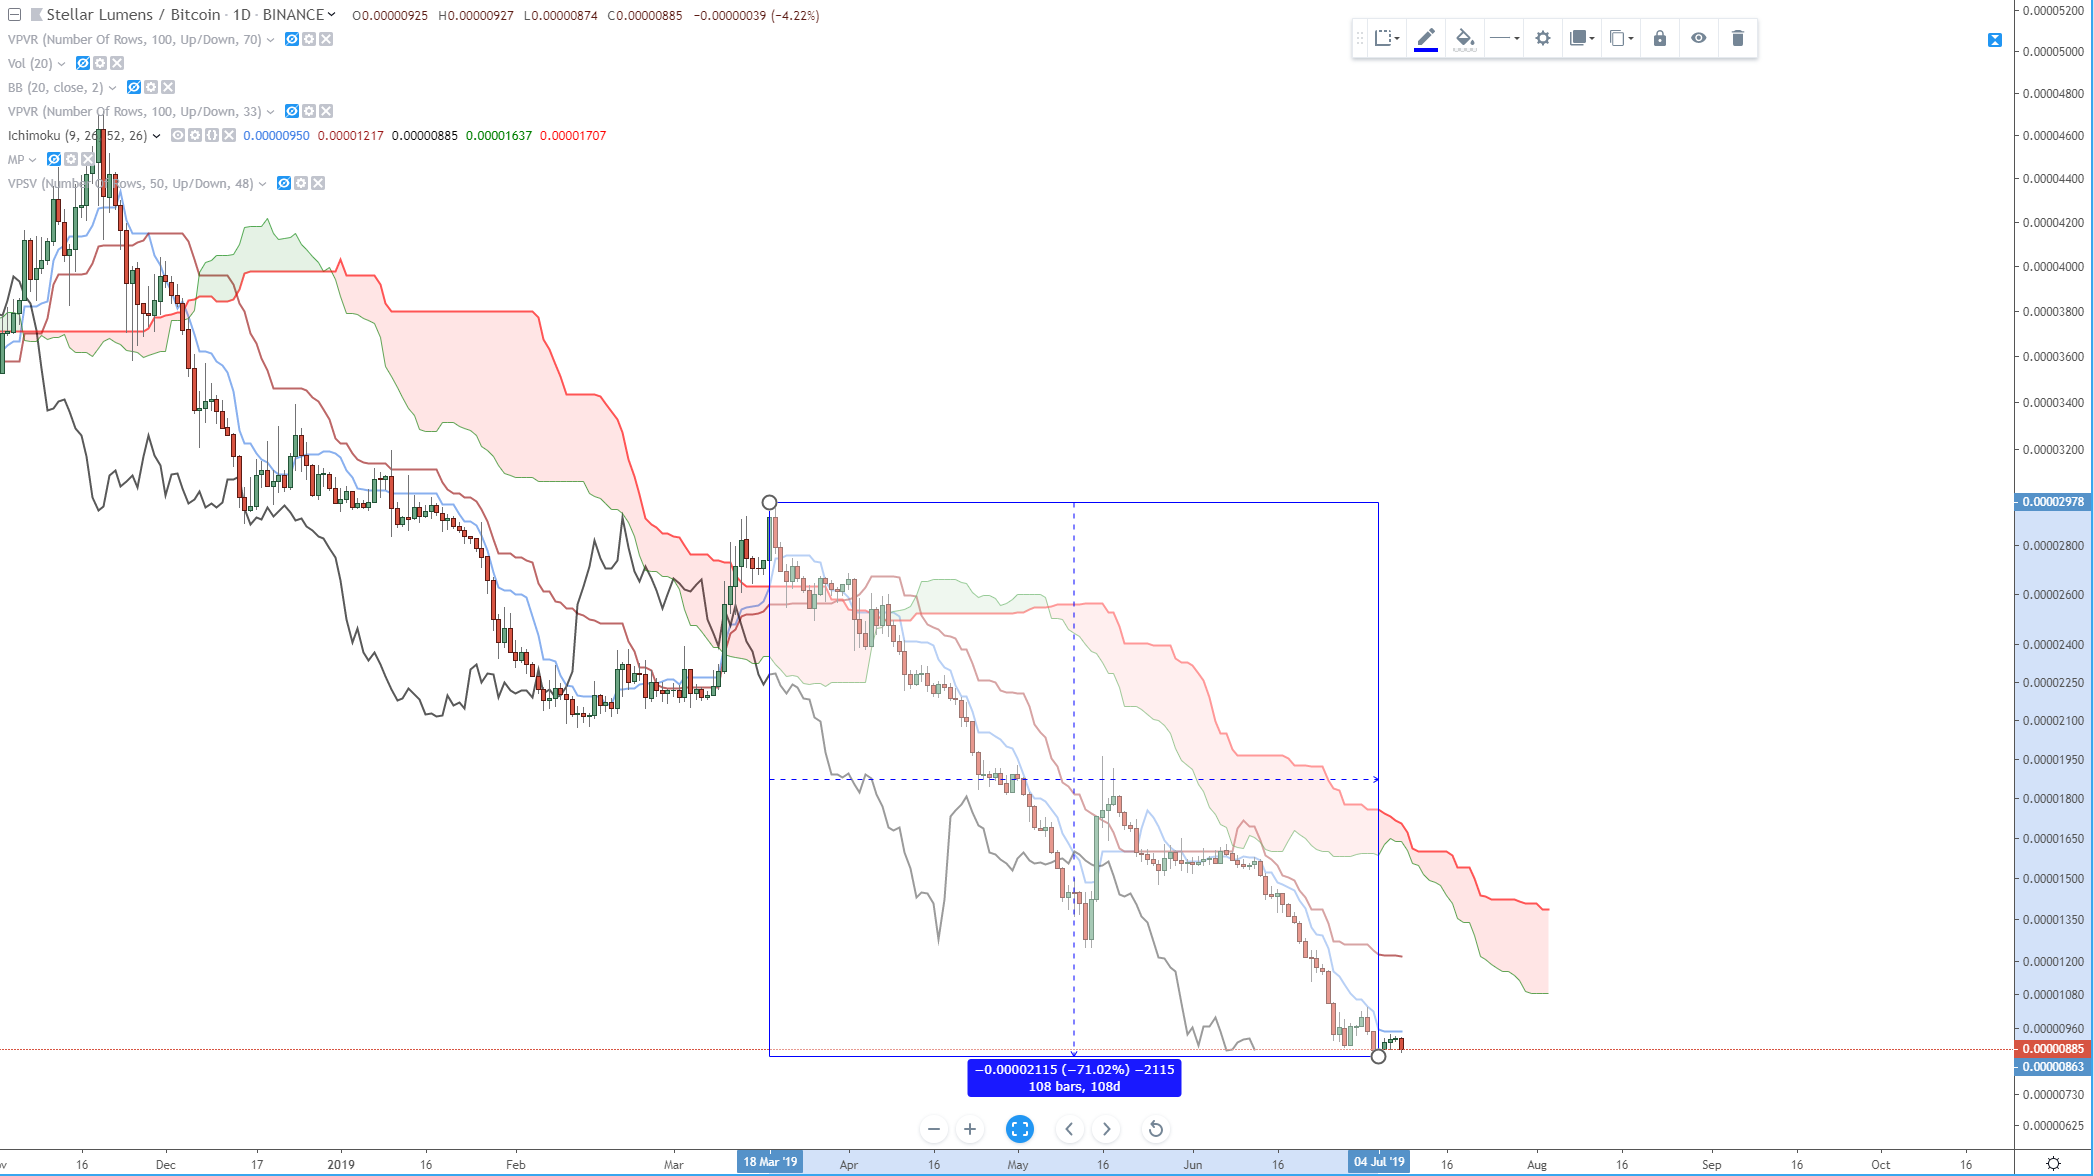
Above: XLM very near its all-time lows.
Stellar Lumens (XLM) – Stellar has not been very… stellar. It actually was fairly stable compared to the broader altcoin market in 2018 and it showed some significant progress and growth with strong partnerships such as IBM. However, Stellar has been slaughtered for the majority of 2019. It’s most recent major swing high was at 0.00002978 on March 18th, 2019. It has since fallen to a new major swing low of 0.00000863 on July 4th, 2019. This represents a -0.000002115 or -71.02% drop over a 108-day period. XLM is current trading where it was at the beginning of when its market opened for trading over 570-days ago and is very close to breaching it all-time low of 0.00000732 which was found on December 10th, 2017.
Polymath (POLY)
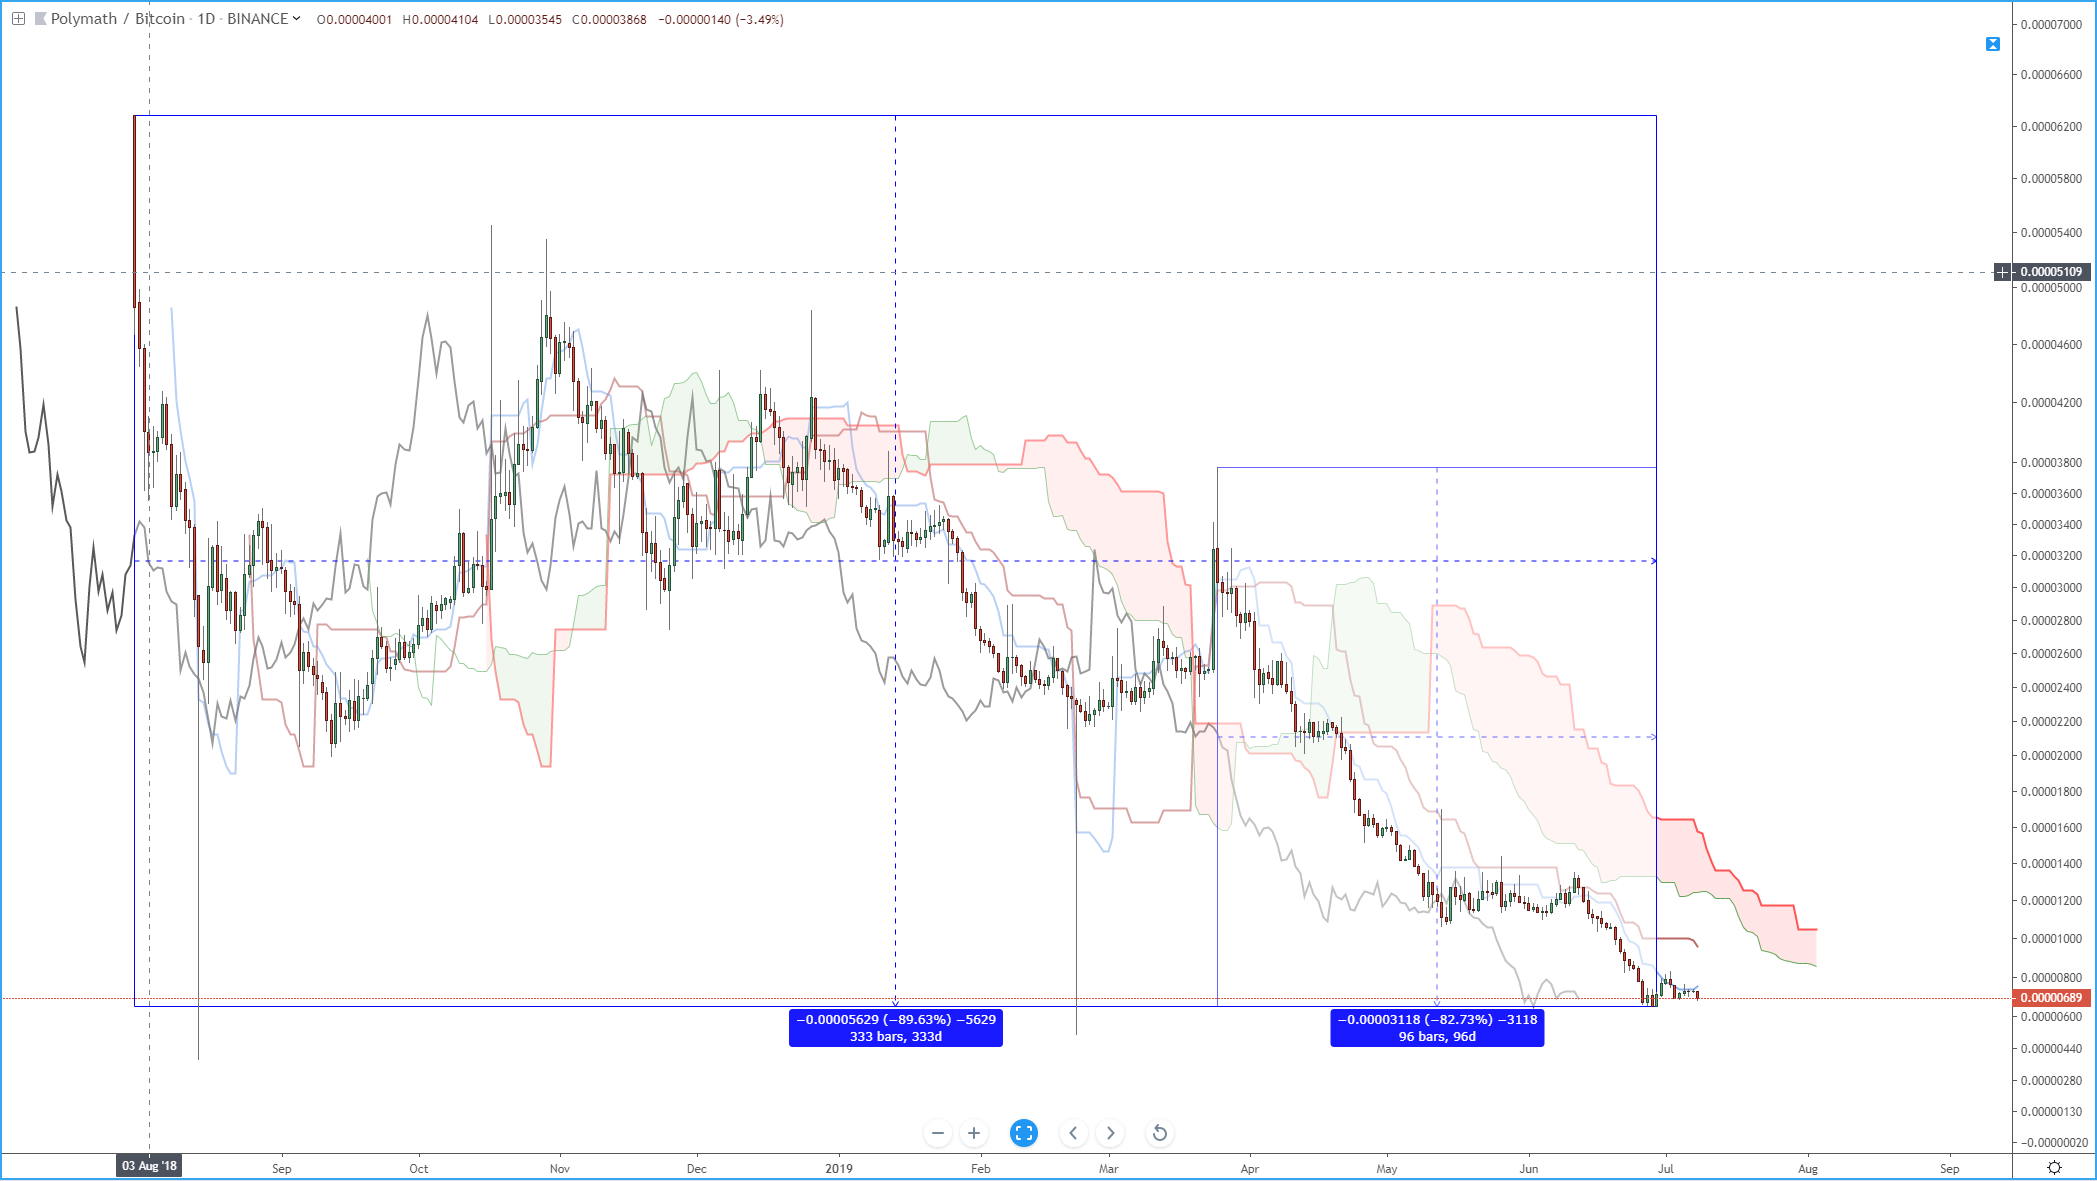
POLY continues to create new all-time lows.
Polymath (POLY) – Polymath has not really had a bullish trading period in its entire history, which started on July 31st, 2018. So it’s been almost a year since Polymath started trading on Binance and Polymath is very close to losing over nearly -90% of its value from where it opened. The current all-time high was the open trading day for Polymath of 0.00006280 on July 31st, 2019. The all-time low is 0.00000651 found just recently on July 4th, 2019. From July 31st, 2018 to the all-time low on July 4th, 2019 we see a 333-day trading period where Polymath has lost -0.000003118 or -89.63%. The most recent swing high for Polymath occurred on March 25th, 2019 at 0.00003769. From that date and price level to the all-time low on July 4th, 2019 Polymath has dropped -0.000003118 (-82.73%) in 96-days. And it looks like that if today’s (July 8th, 2019) trading action continues, we could see even deeper all-time lows for Polymath.
Why I am a bullish at these levels
There are two primary reasons why I am very bullish at these levels and why I have been accumulating so many altcoins from May through July of 2019 – and especially since July. I am a Gann based trader through and through – I base the bias and direction of my trading based mostly on time cycles. Gann wrote about specific day-counts and, what he called, ‘Cycles of the Inner-Year’. The most important of those Inner-Year cycles is the 90-day cycle. I would encourage all readers to find any number of instruments (forex, equities, futures, metals, etc) and find a major/minor swing high/low and then measure out 90-99 days from that low/high. Odds are you will find a turn in the market. A HUGE number of altcoins are experiencing new or major swing lows against Bitcoin since their prior major swing high – and these have occurred over a 90+ day period. Gann wrote that the 90-day period can be extended to 99-days against strong and/or fast momentum. But I am also bullish because of the specific seasonal range that these major lows are being found. Gann specifically called out the date range of July 3rd to July 7th as a date range to find market reaching major lows or major highs. Gann indicated trends often terminate around these dates and to look for countertrend moves. That is exactly what I expect to see happen here in this market beginning this week and moving into next week.
From : Exchangerate.org.uk


No comments:
Post a Comment