While financial forecasters are predicting a bullish 2019 for the bitcoin price, the cryptocurrency first needs to fight strong technical barriers in the near-term.
It is becoming difficult for bitcoin bulls to initiate a substantial push towards the $3,480-barrier and beyond. At the same time, their presence at the support area above $3,371 is stopping the price from further downside action. The situation has led bitcoin to remain rangebound, which is increasing the bearish sentiment in the near-term scenario.
On the intraday/weekly level, bitcoin could now pursue another selling action thanks to two pressing issues: lower volatility and volume. Let’s discuss them in the sections as follows.
BITCOIN PRICE SEES JANUARY DEJA VU
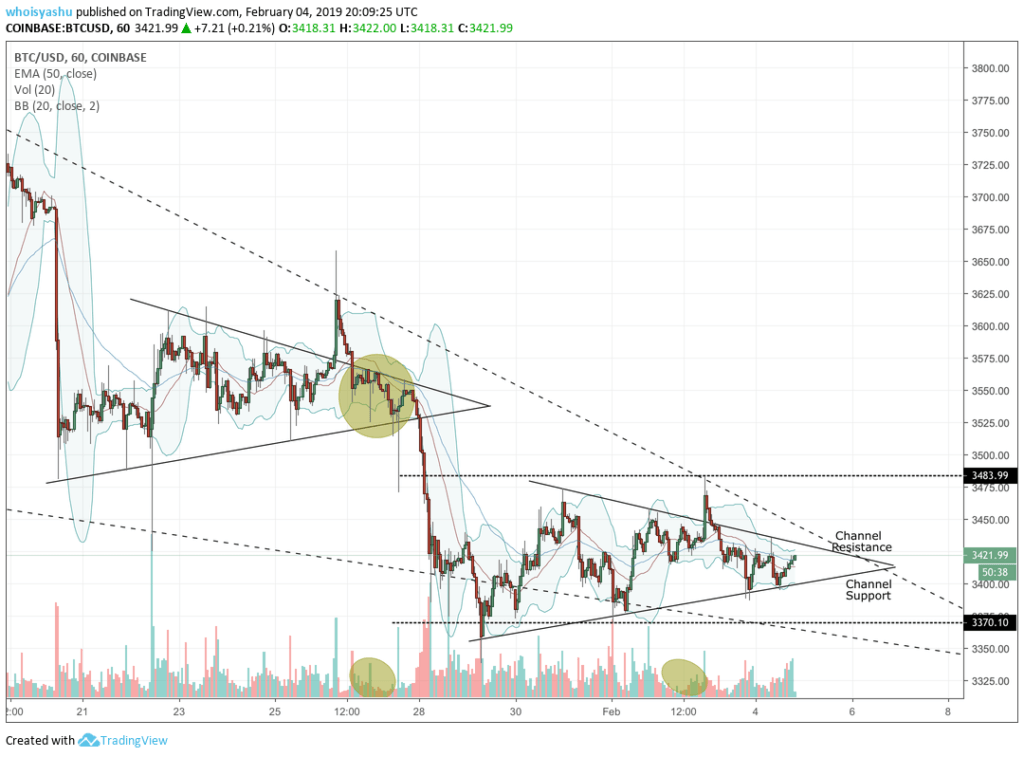
Bitcoin is somewhat imitating the price action between January 26 and January 27. Back then, it was trending inside a triangle formation. As the pattern extended and trading range started contracting, the volume also began to diminish. In parallel, the gap between the upper and the lower Bollinger Band, which is directly proportional to an asset’s volatility, also started to minimize. On January 28, the bitcoin price broke down from the triangle pattern.
In the current trading range, the bitcoin chart is expressing a similar trend sentiment. The price is trending inside a new triangle pattern while the Bollinger Bands’ gap and hourly volume are declining. Bitcoin, like the previous time, has broken above the channel support to form a higher high towards the resistance of a medium-term falling wedge pattern (indicated via a dotted descending trendline). And it has come back inside the triangle channel – just like in the case of the first triangle.
If the scenario is to be believed, bitcoin price could retest the channel resistance, only to follow a pullback action towards the channel support. After that, the price could keep consolidating inside the channel or attempt a breakdown towards the falling wedge support.
FALLING WEDGE
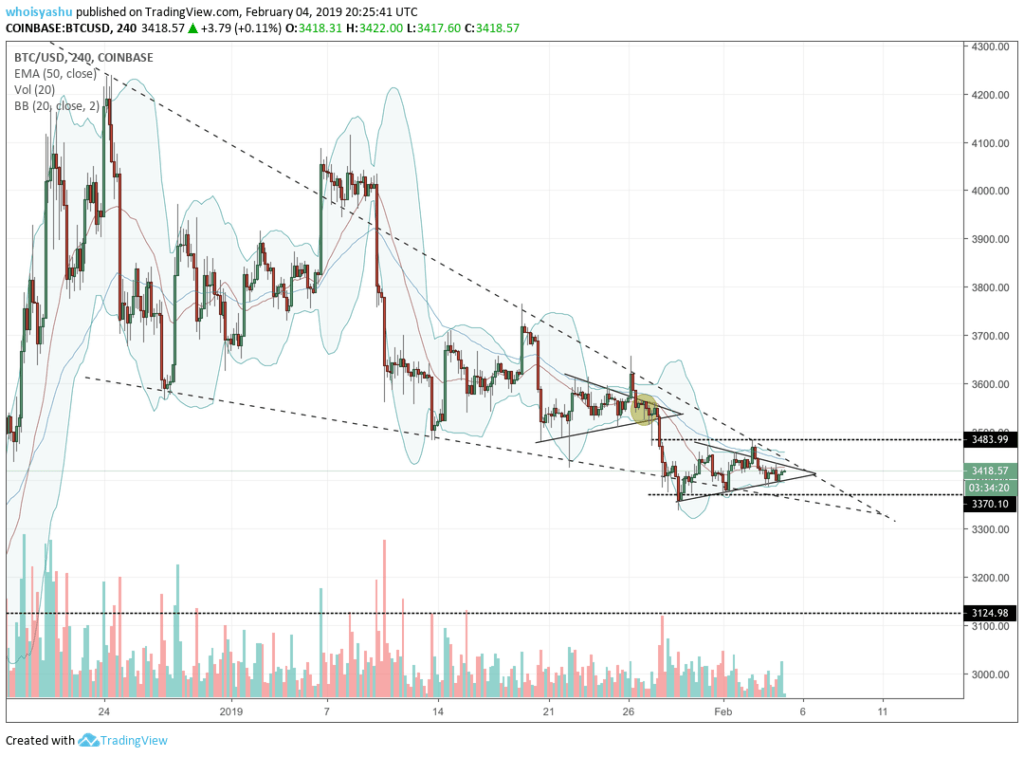
Technically, a falling wedge pattern is a bullish indicator. It begins broadly at the top but squeezes as the asset moves lower while forming reaction highs and reactions lows that eventually converge. Upon closing in towards the cone’s apex, the asset undergoes a resistance breakout to find a new support area.
The bitcoin price is similarly closing in on its falling wedge’s apex. It should break out to the upside in ideal circumstances, but given the moody nature of the market, a breakdown is also possible. The latter would likely push the price back towards $3,100, the market’s previous bottom level.
INTRADAY STRATEGY
Keeping trades inside the triangle channel looks ideal at this point in time. That said, entering a long position towards resistance on a pullback from support would yield small profits. At the same time, maintaining a stop loss order 1-pip below the swing low would minimize losses in case the trend reverses.
Similarly, a reverse from resistance would open a decent short opportunity towards support, providing a stop loss 1-pip above the local swing high is placed to maintain the overall risks.
Featured Image from Shutterstock. Charts from TradingView.


No comments:
Post a Comment